
Insights · The Church Attendance Playbook

The Summer Dip Is Real — Here's What the Data Actually Shows

Every pastor knows attendance softens in summer. Few know when it starts, how deep it actually runs, or when it ends — because very few churches track it with the precision that would let them answer those questions. We pulled the data to find out.

· 10 min read · Original research

−20%
average drop from spring baseline at the summer trough
13 wks
average duration from first sign to full recovery
Early June
when the dip typically begins — not Memorial Day
9 of 9
years with a measurable dip in one church's decade of data

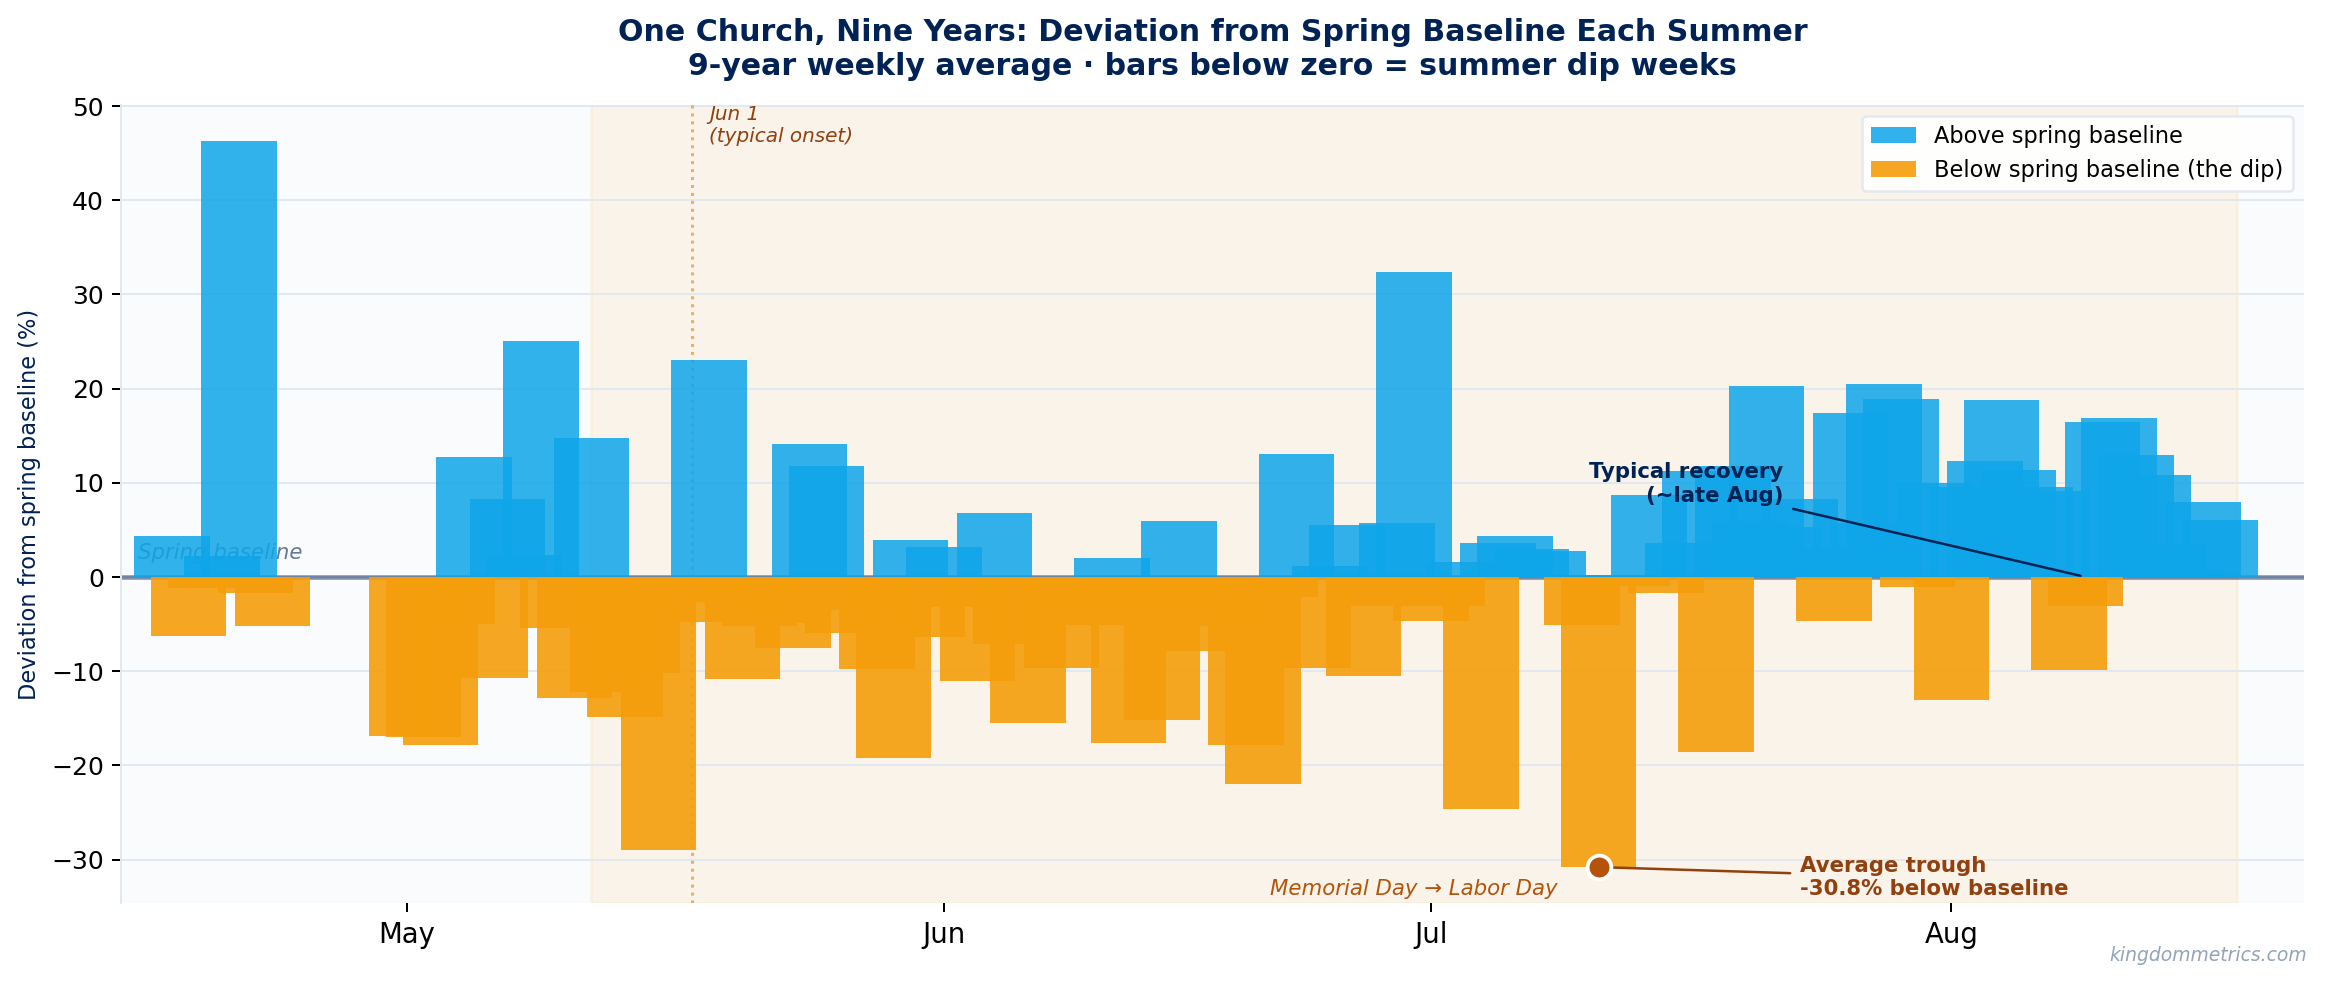
"Attendance is just soft in the summer" is one of the most widely shared explanations in church leadership — and one of the least examined. It is shared casually, accepted without question, and almost never followed by a second question: by how much, exactly, and for how long?

That second question turns out to be worth asking. Because when you pull weekly attendance data across multiple churches and multiple years, the answer is more specific — and more interesting — than the conventional wisdom suggests.

The Dip Everyone Feels, Few Measure

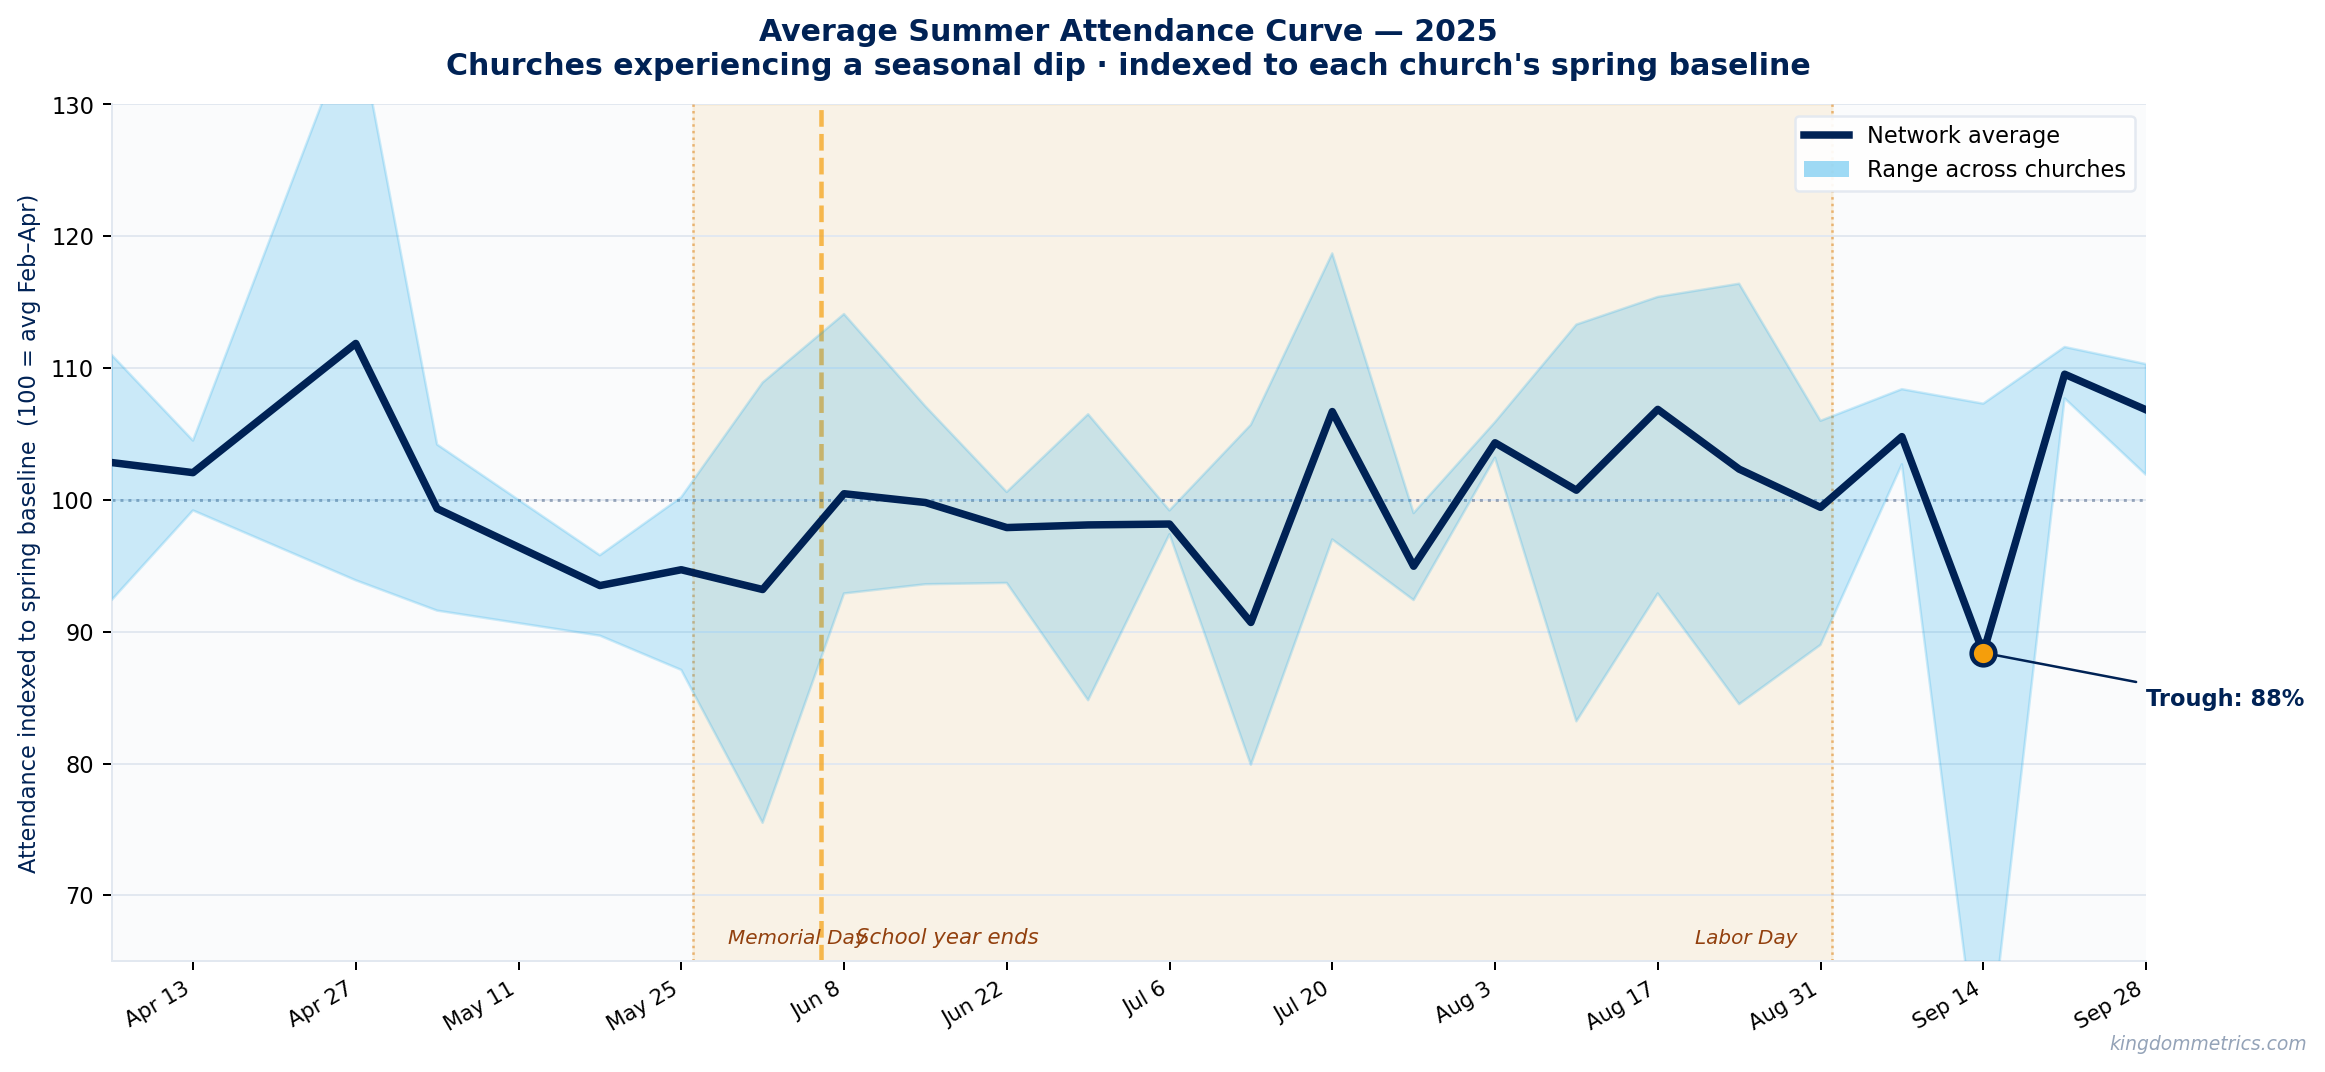
We looked at seven churches in the Kingdom Metrics network with consistent Summer 2025 data, indexed each week's attendance to that church's spring baseline (average weekly attendance in February through April), and tracked what happened through Labor Day.

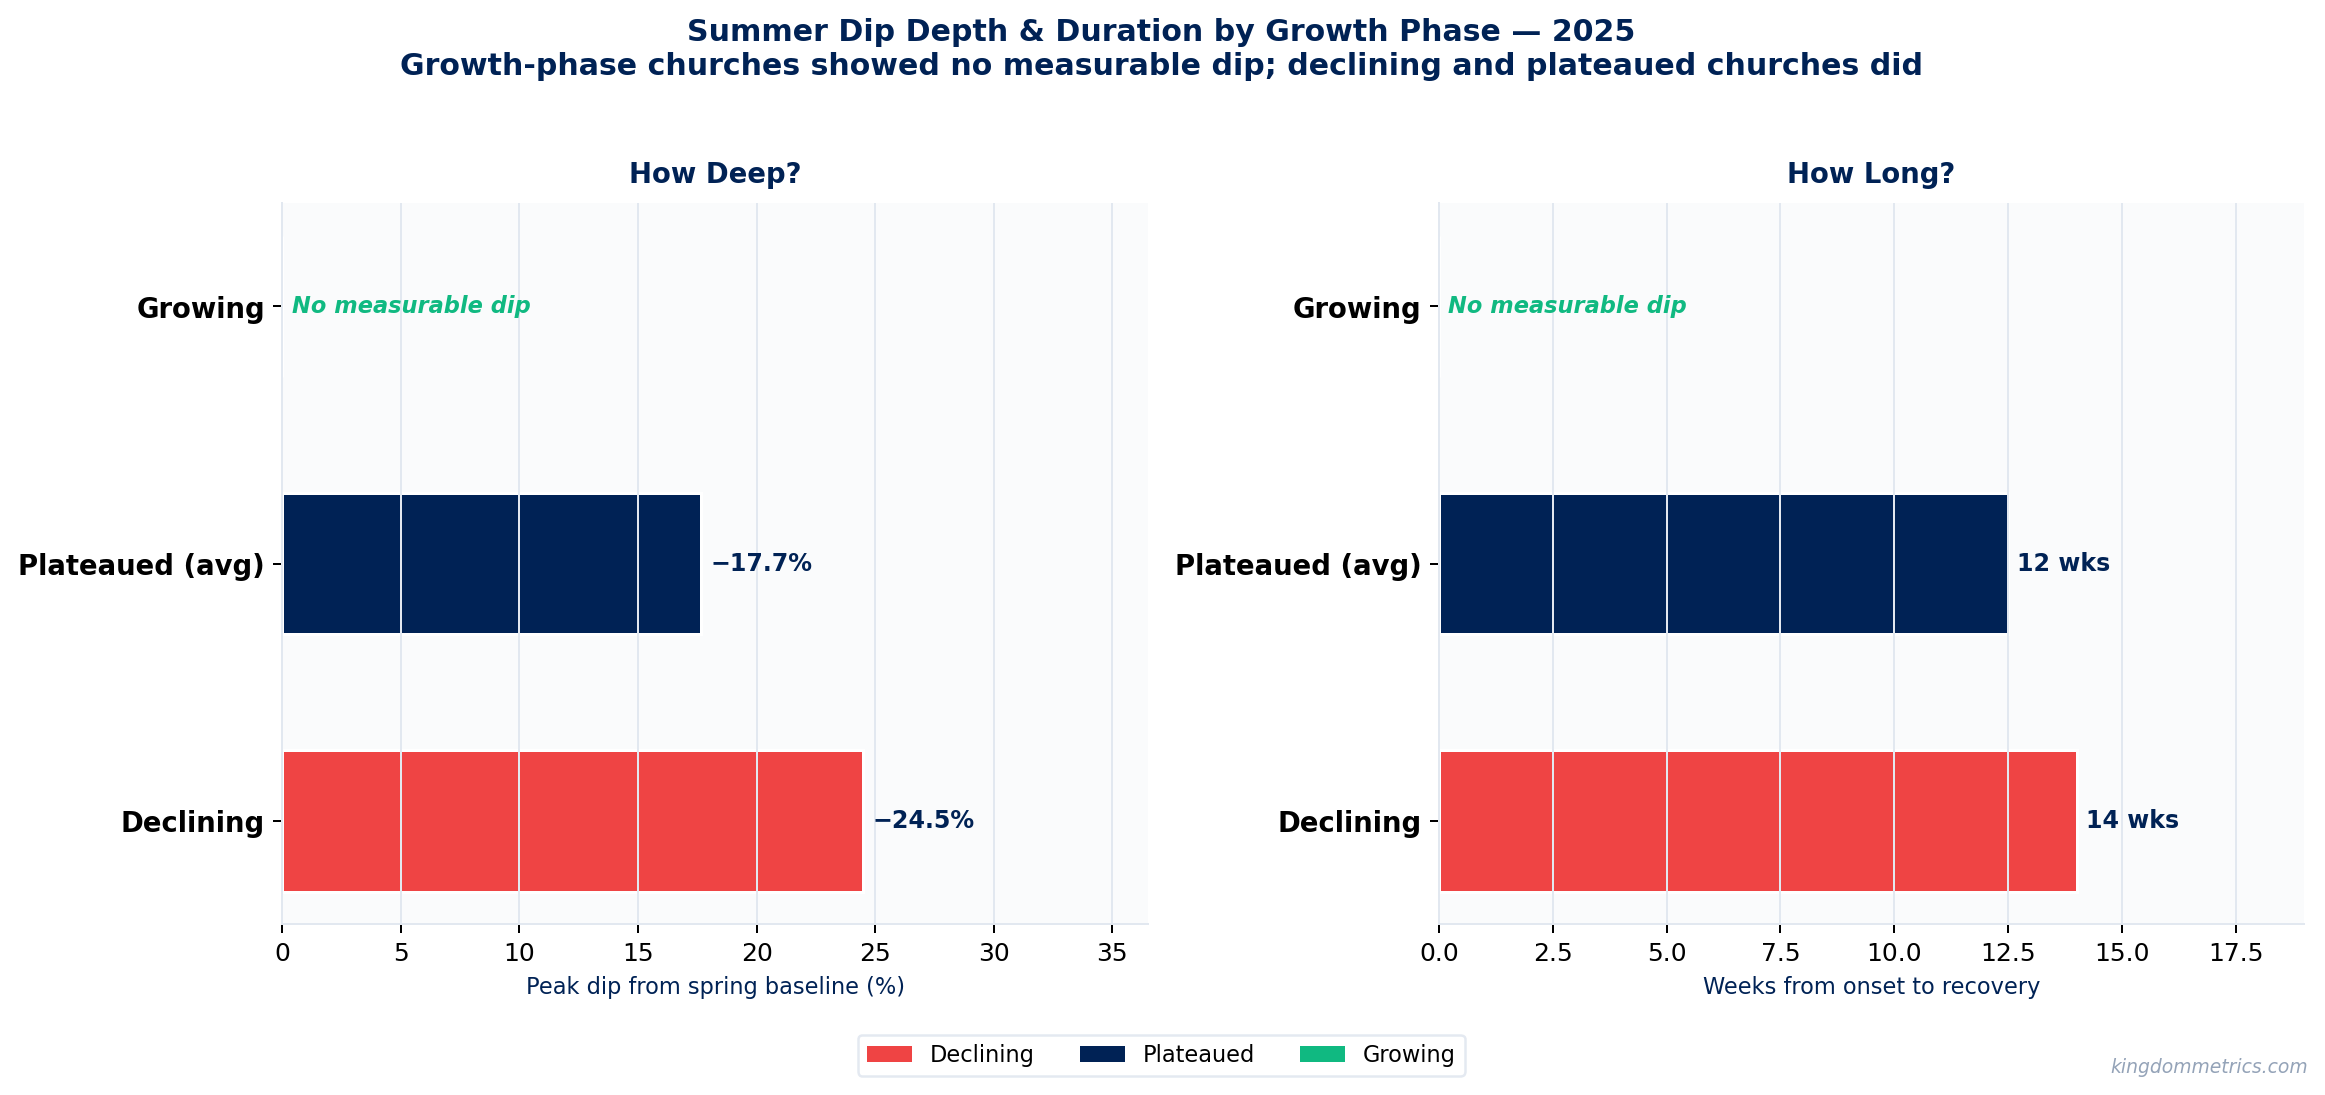
Not every church dipped. That finding matters before anything else. The churches that stayed above their spring baseline all summer were in active growth phases — adding new attendees consistently enough that seasonal softness was absorbed by momentum. The churches that dipped were either declining or plateaued. That split is not a coincidence.

The summer dip appears to be, at least in part, a growth-phase signal. Growing churches — in the Unstuck Group sense of the word, with consistent new-attendee inflow and expanding engagement — may not experience it the same way a plateaued or declining church does. Before you read the rest of this analysis, it is worth asking honestly: which category describes your church right now? The data looks different depending on the answer.

Quick self-assessment (Unstuck Group framework):
  • Growing: Consistent new-attendee inflow, expanding volunteer base, AWA trending up year-over-year
  • Plateaued: Attendance stable but flat, same faces most weeks, growth has stalled
  • Declining: AWA trending down over 12–24 months, volunteer gaps, reduced engagement

For the churches that did dip, the trough averaged around 20% below spring baseline — not catastrophic, but not trivial either. For a church averaging 800 on a typical spring Sunday, a 20% dip means roughly 160 fewer people at the low point. The question is whether that's anticipated and planned for, or whether it arrives as a surprise every June.

When Does It Start? Memorial Day or School's End?

The conventional narrative says summer starts at Memorial Day. The data says: it depends. For the churches that dipped, onset varied by two to four weeks — some dipped before Memorial Day, some after, and one tracked closely to the end of the local school year in early June.

The chart below shows indexed weekly attendance from April through late September 2025 for four churches. The amber shading covers Memorial Day through Labor Day. The dashed line marks when most schools in these markets let out for summer.

Average indexed summer attendance curve, 2025: network average with a shaded range band dipping below the spring baseline through the summer before recovering by Labor Day.
Average of churches experiencing a seasonal dip, indexed to each church's Feb–Apr spring baseline (100 = average spring Sunday). Shaded band shows range across churches. Dot marks the trough.

The variation in onset timing raises a question that most attendance tracking systems cannot answer: is your summer dip driven by the holiday calendar (Memorial Day) or by the school calendar (last day of school)? For sunbelt churches with families on a different release schedule than northern markets, the answer might be different — and it might shift your planning window by two to four weeks.

Worth asking: Do you know when your summer dip starts in your specific market? Does it track Memorial Day, or does it lag by two to four weeks until school actually ends? That distinction — if you could answer it with certainty — would change when you shift staffing, programming, and service configuration.

If you have historical attendance data, we can tell you exactly when your dip typically ends — so you know the date to plan your fall re-engagement around. No guesswork. We'll do the analysis for free.

Send us your data → [email protected]

The Easter Bridge: Seven Weeks Nobody Tracks

There's a gap in the conventional narrative that the data makes visible: the stretch between Easter and the summer dip onset. Call it the Easter Bridge — roughly seven weeks from Easter Sunday to Memorial Day when churches are neither celebrating a spike nor bracing for a dip.

It is also, in the data, a period of meaningful attendance variation. Some churches saw elevated numbers through May (Easter guests still returning, spring programming driving engagement). Others showed a quiet early decline before Memorial Day. The churches in strong growth phases barely registered the transition at all.

The implication: the move from Easter season into summer is not a single event — it's a transition with a shape that varies by church. Knowing that shape, in your context, would let you make decisions about spring programming and May engagement with more precision than the broad-brush "push hard in spring" advice that currently substitutes for data.

Note on data scope: Easter week itself is excluded from the indexed baseline calculations throughout this analysis. Easter is a growth driver, not a typical Sunday, and blending it into a spring average would inflate the baseline and understate the summer dip. See methodology below.

How Deep, How Long? The School Calendar as a Trigger

For the churches that dipped, the numbers were consistent enough to be actionable. The trough wasn't at the same depth for every church, and it didn't last the same number of weeks — but it was real, and it was measurable.

Per-church summer dip depth and duration by growth phase: declining churches dipped deepest and longest, plateaued churches slightly less, growing-phase churches showed no measurable dip.
Growth phase labels based on Unstuck Group framework. Plateaued bar = average of two plateaued churches. Dip depth (left) = how far below spring baseline the trough fell. Duration (right) = weeks from onset to recovery. Growing-phase churches showed no measurable dip in 2025.

The phase label on the y-axis is the most important variable. Declining churches dipped the deepest and stayed down the longest — up to 14 weeks. Plateaued churches followed a similar pattern with slightly less severity. Growing churches, absorbing new attendees steadily, showed no measurable drop relative to their own spring baseline.

Fourteen weeks is an entire programming season. If your church is plateaued or declining and you are planning for a two-to-three-week summer softness, you are structurally under-resourced from late May through early September. The question is not whether to plan for the dip — it is whether your plan matches the actual duration your growth phase predicts.

Recovery timing also showed school-calendar alignment: churches in markets where school returned in mid-to-late August recovered earlier. Churches in areas with later fall starts recovered closer to Labor Day.

One finding that did not fit the "recovery" frame: plateaued churches did not just return to their spring baseline in fall — they exceeded it. Both plateaued churches in our data averaged around 105% of their spring baseline in September and October, with individual weeks hitting 108–109%. Fall is not a return to normal. It is, in this data, the attendance peak of the year.

The reframe: The summer dip is not a loss you are recovering from. It is the valley between two peaks — spring and fall. If that is true for your church, the strategic question shifts from "how do we survive summer" to "how do we capitalize on the fall surge?" Churches that treat Labor Day weekend as a relaunch moment — with intentional series starts, re-engagement campaigns, and volunteer re-activation — may be doing so for good empirical reasons.

A Decade of Evidence: The Dip Is Not a Fluke

The year-over-year consistency question — is this a 2025 artifact or a durable pattern? — gets its clearest answer from one church in our network with ten years of consecutive summer data (2015–2025, excluding 2020). The chart below collapses those years into a single average curve with a shaded band showing the typical range.

A decade of summer attendance dips, 2015–2025: each year's average weekly deviation from its spring baseline, with blue bars above baseline and amber bars below — a dip in every single summer.
Each bar shows the 9-year weekly average deviation from that year's spring baseline. Blue bars = above baseline. Amber bars = below baseline (the dip). Church identity withheld.

The bar chart makes the pattern hard to argue with. Every summer, the same shape: dip in early June, trough somewhere in late June or July, gradual recovery through August. The absolute headcount grew substantially over the decade, but the indexed deviation barely moved year to year. The summer dip is not a bad year. It is a season. It happens every year, and it ends every year.

Worth sitting with: this same church grew its spring baseline by 136% over those ten years — from roughly 570 to over 1,300 in average weekly attendance. It dipped every summer during that entire run. The dip did not prevent growth. It coexisted with it. What the church apparently did was build the kind of year-round health that meant the summer valley never turned into a permanent floor. The question is not whether your church will dip this summer. The question is what you are building the other nine months of the year.

This is the value of historical data: not to predict the future precisely, but to replace "I wonder if we'll dip this summer" with "we know we dip, here's roughly when it starts, and here's when we can expect it to end." That shift from uncertainty to expectation changes how you plan.

Want to see your own historical summer curve?

If your church has been collecting attendance data, we can run your historical summers — for free — so you know what to expect and for how long. No commitment required.

Email us at [email protected]

Why Does It Happen? Two Hypotheses, No Verdict

The attendance data tells you that a dip happens and when it happens. It does not tell you why. Two hypotheses compete, and they probably both contain some truth:

Hypothesis 1: Absence. Families with school-age children travel, attend camps, go on vacation. They are physically not in your market on a predictable fraction of summer Sundays. This is a demand-side explanation — the audience shrinks. If this is the primary driver, onset should track closely to when school lets out (early June in most US markets), not to Memorial Day.

Hypothesis 2: Experience. Summer disrupts routine, and routine is a significant driver of consistent church attendance. People who come every week in the fall and winter develop irregular summer habits — not because they are traveling every week, but because the rhythm breaks once and takes time to re-establish. This is a habit-disruption explanation — the same audience shows up less predictably.

The two hypotheses have different implications. If it's mostly absence, you are managing a headcount floor, and the strategy is mostly about holding engagement until the audience returns. If it's mostly habit disruption, early-summer engagement — the first few Sundays after school ends — might disproportionately affect whether people maintain attendance through the summer or gradually drift. We do not have the data to adjudicate between them. What we do have is the pattern — and the question is worth asking before you assume an answer.

Questions Worth Asking

The analysis does not resolve into a prescriptive action list. Different churches, in different growth stages, in different markets, will face different versions of the summer dip — or none at all. But the data does surface questions that are worth sitting with:

  • Staffing and PTO. The Unstuck Group benchmarks roughly 0.7 FTE per 100 in average weekend attendance, and one volunteer for every five people served (the 1:5 ratio). (Unstuck Group) Both ratios assume a normal Sunday. In summer, attendance drops 15–20% — and so does your volunteer pool, as families travel and schedules loosen. At the same time, staff often concentrate vacation in summer because things feel "slower." But slower by headcount is not the same as lower-stakes: a thinner volunteer corps serving a fragile attendance base is precisely when service quality matters most for retention.

    The question worth asking: How many weeks of staff PTO are actually available in your model — and are those weeks front-loaded into summer simply because the calendar feels lighter, rather than because that's when the church can absorb the absence? Distributing time off across the full year — rather than clustering it in June–August — might be more honest about when your church actually needs full capacity.
  • Service schedule. Some churches run fewer services in summer — consolidating two services into one, for example. The data suggests this is a reasonable response to a real attendance floor. The more interesting question is: does consolidating services change the recovery timing? Do consolidated-summer churches snap back more cleanly in the fall, or does the schedule change itself slow the return to routine?
  • Programming sequencing. If you know onset is typically around June 8–15 in your market, does that change what you launch and when? Does a heavy spring series that ends May 31 leave a gap, or does it intentionally land before the dip with a lower-maintenance summer series behind it?
  • First-timer experience in summer. Anecdotally, summer is when some first-time visitors show up — neighbors, family visiting relatives, people with more open calendar space. If attendance is down but first-time visit rates are steady or higher, the composition of the room is changing in ways that matter for follow-up and assimilation. Do you know if that's true for your church?

Methodology

For the data nerds

Analysis covers 7 churches in the Kingdom Metrics network with consistent Summer 2025 weekly attendance data (January–October 2025). Spring baseline = average weekly attendance in February, March, and April, excluding Easter Sunday (April 20, 2025). Indexed attendance = that week's total divided by spring baseline × 100. Summer trough = lowest indexed week in June–August. Onset = first week after Memorial Day where indexed attendance falls below 95%. Recovery = first week in September or later where indexed attendance returns to 95% or higher. The multi-year case study covers one anonymous church in the KM network, Feb–Aug for each year 2015–2025 (2020 excluded for COVID; 2021 excluded as a post-COVID anomaly); each year is indexed to that year's own Feb–Apr baseline. Weeks with zero total attendance are excluded from all calculations (data gaps, not true absences). Attendance is captured via automated computer-vision counting — not self-reported, not check-in-tied. Individual church data is not disclosed. Growth-phase terminology (Declining / Plateaued / Growing) is based on the Unstuck Group framework. A "dip church" is defined as one whose trough fell below 95% of spring baseline.

Frequently Asked Questions

The summer church attendance dip, answered

Is the summer attendance dip in churches real?

Yes — but not for every church. Across seven churches with consistent 2025 data, the ones that dipped fell to a summer trough averaging about 20% below their spring baseline, and one church in our network showed a measurable dip in 9 of 9 years across a decade (2015–2025). Churches in active growth phases, however, often showed no measurable dip at all.

When does the summer church attendance dip start?

Typically in early June — closer to the end of the local school year than to Memorial Day. Among the churches that dipped, onset varied by two to four weeks, and the timing tracked the school calendar more than the holiday calendar.

How much does church attendance drop over the summer?

For churches that experienced a dip, the summer trough averaged roughly 20% below the spring baseline. Declining churches dipped the deepest and stayed down the longest — up to 14 weeks — while plateaued churches followed a similar but milder pattern.

When does church attendance recover after the summer?

Recovery tracked the school calendar: churches in markets where school returned in mid-to-late August recovered earlier, while others recovered closer to Labor Day. Plateaued churches often exceeded their spring baseline in the fall — averaging about 105% in September and October — making fall the attendance peak of the year.

Does every church have a summer attendance dip?

No. The summer dip appears to be, at least in part, a growth-phase signal. Churches adding new attendees consistently absorbed the seasonal softness and showed no measurable drop, while plateaued and declining churches did dip.

Part of our guide to church metrics — the numbers that tell you whether your church is actually growing.

Does your church have a summer dip — or not?

Kingdom Metrics tracks weekly attendance by service automatically, so you can see your own indexed curve — onset, trough, recovery — without a spreadsheet. If you're curious what your data looks like, we're happy to show you.